At Level 1 a student should be able to-
– Give a broad overview of the project and understand the necessity of sequencing.
– Understand how to break a project into tasks and sub-tasks.
It is important for a young engineer to quickly learn the importance of personal time management (Hawkes and Abinett 1984: 32, Dieter and Schmidt 2009: 145, Haik and Shahin 2011: 56). Planning correctly reduces the possibility of having to repeat work later in the project; wasting time and as the business axiom suggests ‘time is money’. An effective plan ensures all tasks are completed, however, an efficient design ensures they’re completed correctly, first time, and in the shortest time possible (Dieter and Schmidt 2009: 145).
“Proper Preparation Prevents Poor Performance”
(Military addage)
Many students fail to prepare a time-plan when they have a coursework to hand in, they merely suppose they’ll have enough time to complete the project. Usually, they are wrong!!
Consider the basic time-plan in Figure 1 depicting the delivery of a prototype kettle to a customer.
![]()
Figure 1 – Basic Time-plan
This tells you that you have three months to complete the project; which is not very useful. It doesn’t give much information. It doesn’t say what steps are involved; who’s assigned to what step; how long those steps will take; potential holidays; factory shutdowns; delays, allowance for problems, other projects to be completed, exams.

Figure 2 – Intermediary Time-plan
Figure 2 is far more descriptive. It has been split onto different levels to help visually differentiate the tasks. Some sub-tasks may begin together, and others require one task to complete before the other begins.
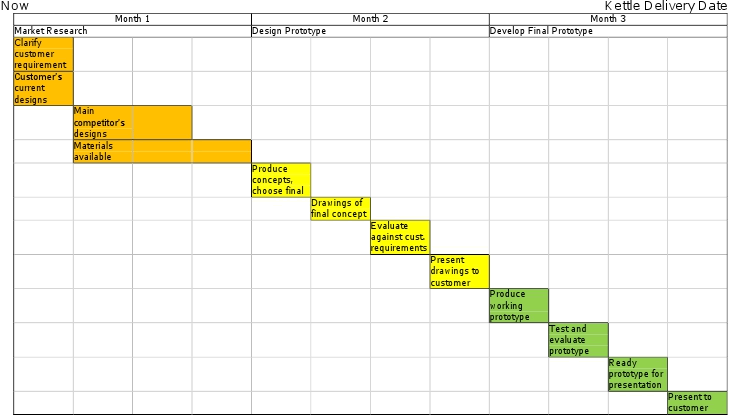
Figure 3 – Advanced Time-plan (Gantt Chart)
Figure 3 clarifies exactly what’s involved within each task by breaking it down further into sub-tasks, this visual plan can be read and understood very quickly and easily. This is known as a Gantt Chart.
A Gantt Chart helps to;
1. List all events or milestones of the project in an order list.
2. Estimate the time required to establish each event.
3. List the starting time and end time for each event.
4. Represent the information in a bar chart.
(Haik and Shahin 2011: 56)
The times above are based on the opinion of the person writing the Gantt chart, you should give yourself enough time and allow a suitable amount of time to complete each one.
You must consider how to generate the sub-tasks that are required to complete each area. Figure 3 suggests that to complete a Market Research, you will need to complete four separate sub-tasks, how do you clarify these sub-tasks?
You might use a method known as “Mindmapping”. This well-documented technique can be applied to many areas, however it is particularly useful to help generate these sub-tasks. Consider Figure 4, mapping the plan for the prototype kettle, as you can see it goes into far more detail than has been represented in the Gantt Chart in Figure 3.
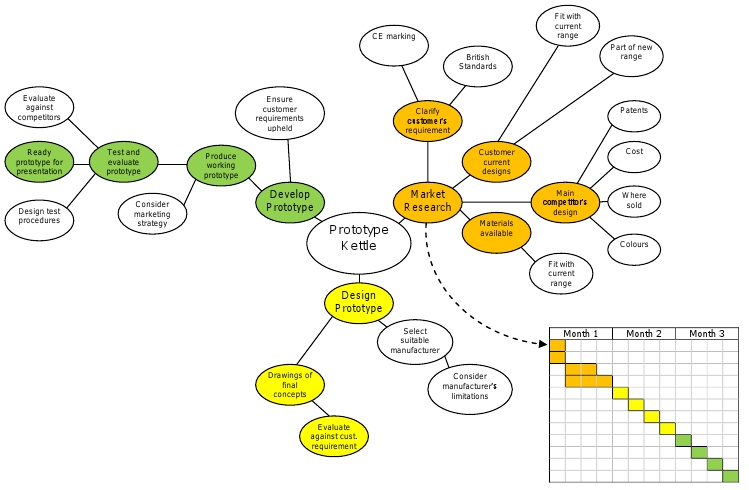
Figure 4 – Mind Map for Gantt Chart
The titles on Figure 4 may not directly correlate with tasks and sub-tasks in Figure 3, however this technique allows you to fully explore the problem and consider EVERYTHING that might be involved. Leave nothing out; holidays, days-off, weekends, cricket tournaments if necessary, they’re all times you’re unlikely to complete work. If you fall behind schedule, you MUST update the Gantt chart and work out where you can make up the lost time.
Summary
An efficient time plan will reduce the probability of failing to meet a deadline and/or failing to thoroughly explore a design problem and risk leaving something out. Remember, time is an irreplaceable commodity (Dieter and Schmidt 2009, 145).
Figures 5-7 on the following pages give some examples of Gantt Charts, the formats may differ but that all are designed to do the same thing. This is a well documented technique and you should try to find your own material on the subject.
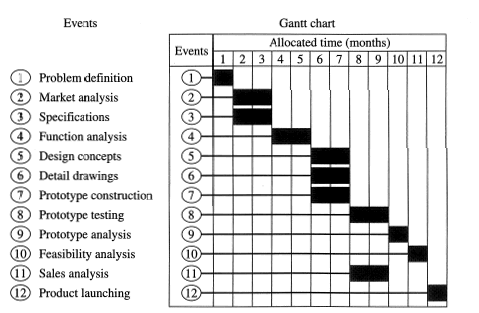
Figure 5 – Gantt Chart for generic design on an item (Haik and Shahin 2011: 56)
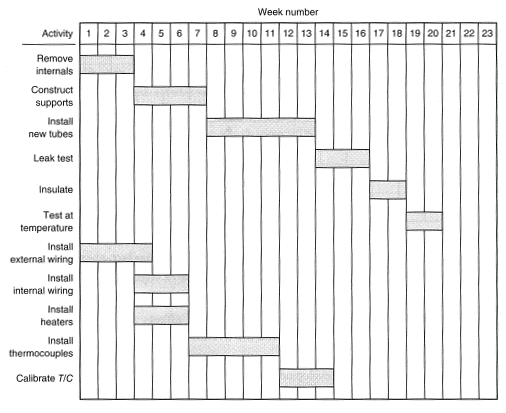
Figure 6 – Gantt Chart depicting installation of heat transfer tubes in existing shell
(Dieter and Schmidt 2009: 150)
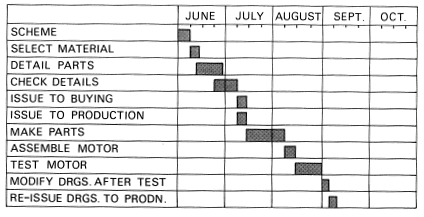
Figure 7 – Gantt Chart depicting planning, design and building of a hydraulic motor
(Hawkes and Abinett 1984: 32)
Back to Planning and Clarification
Back to MAE Design Model